Graphs
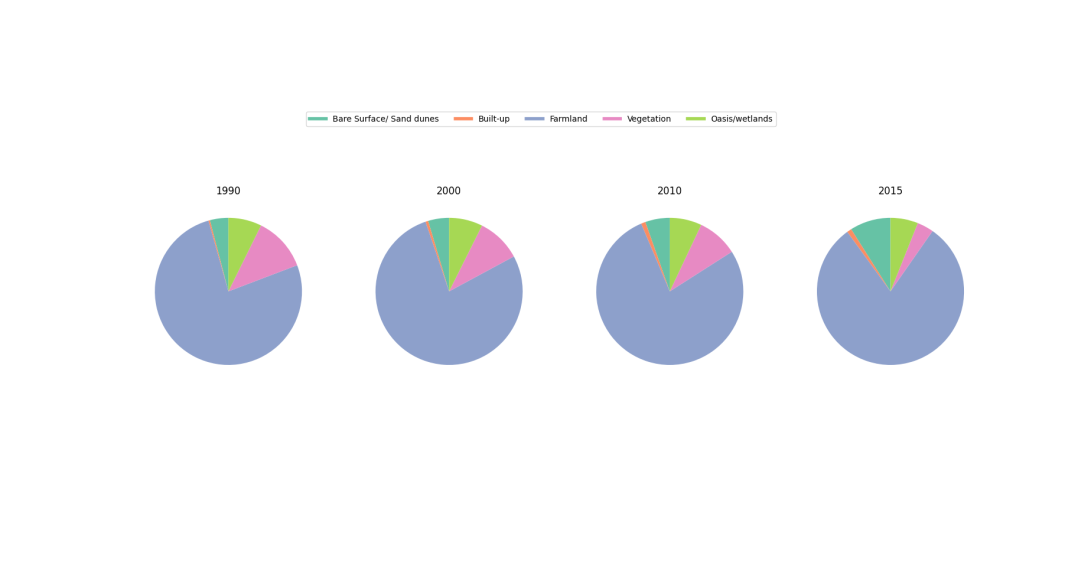
Land Cover Changes from 1990 to 2015
This graph depicts the land cover changes from 1990 to 2015.
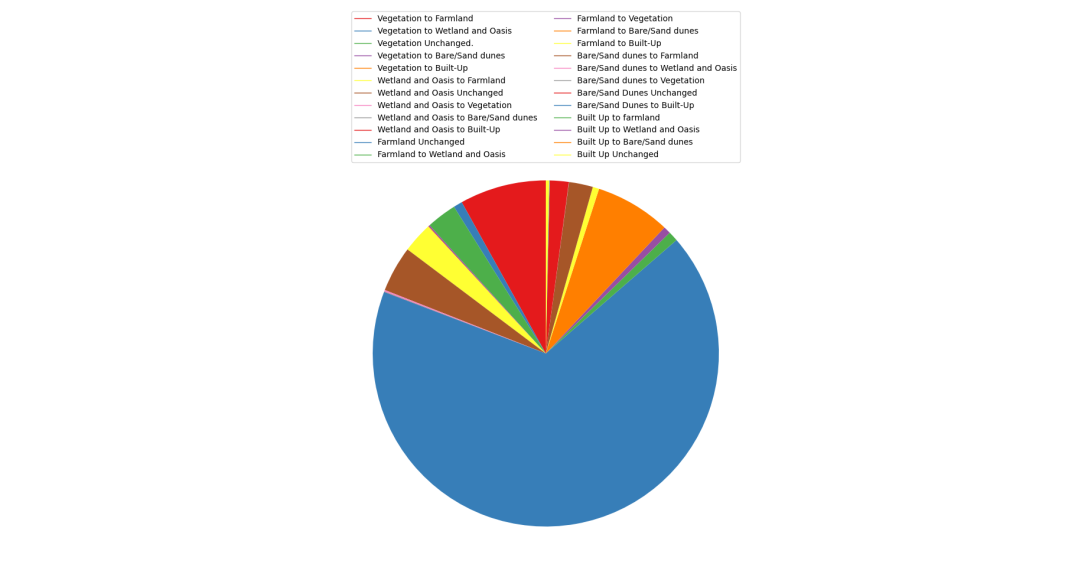
Land Cover Conversions from 1990 to 2015
This graph depicts the land cover conversions from 1990 to 2015.
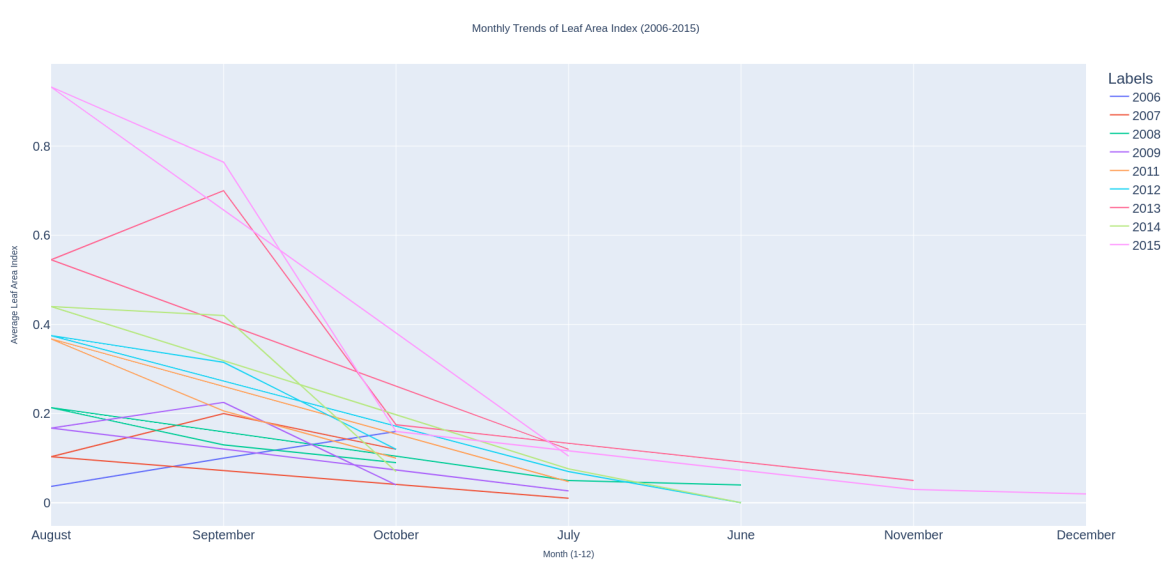
Leaf Area Index across years - NORD
This graph depicts monthly trends in leaf area index across yearsa at WAKANAMA_NORD Station.
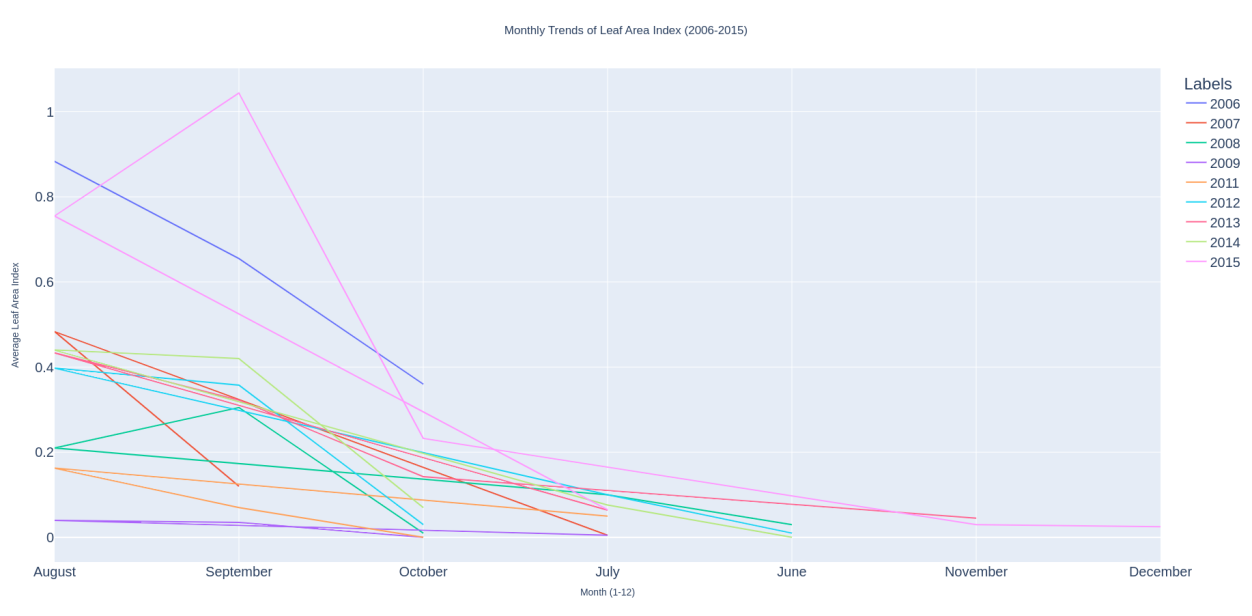
Leaf Area Index across years - SUD
This graph depicts monthly trends in leaf area index across years at WAKANAMA_SUD Station.
Dry Total Biomass Mean across Years - NORD
This graph depicts monthly trends in dry total biomass mean across years at WAKANAMA_NORD Station.
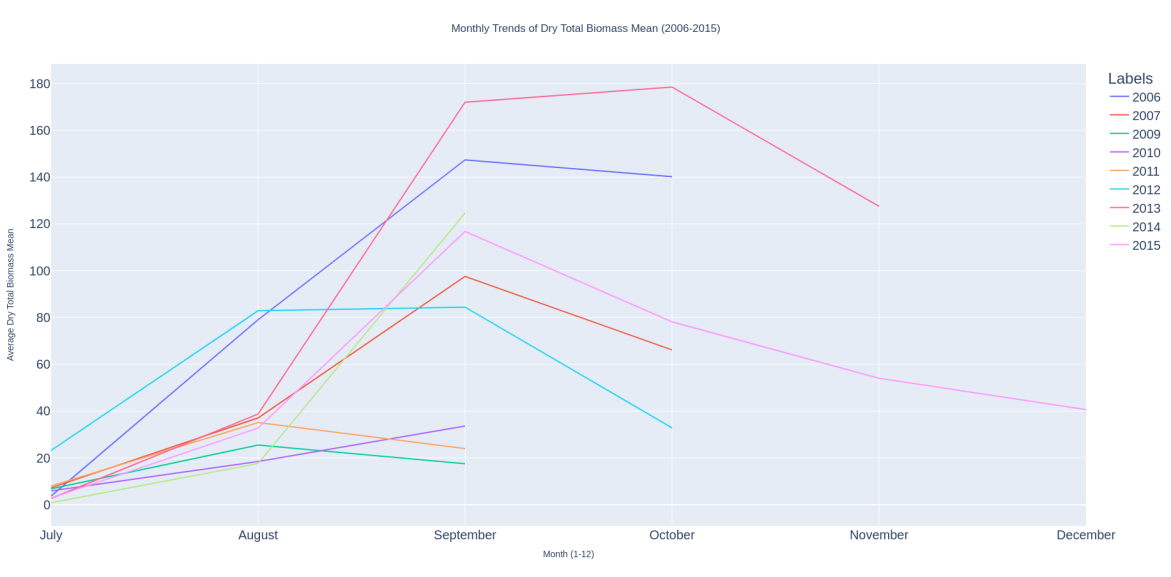
Dry Total Biomass Mean across Years - SUD
This graph depicts monthly trends in dry total biomass mean across years at WAKANAMA_SUD Station.

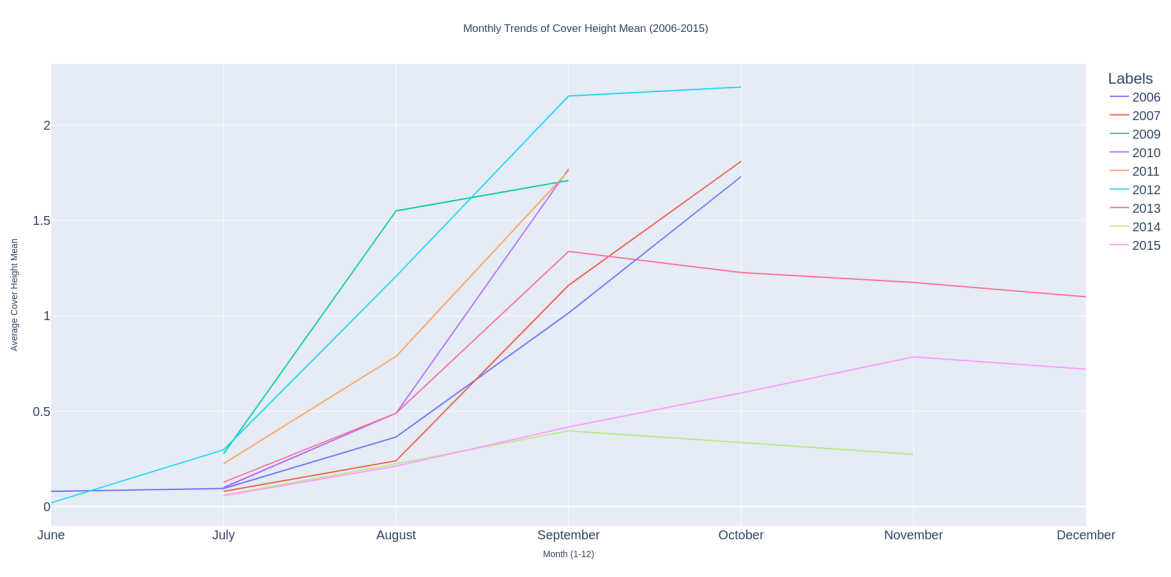
Cover Height Mean across Years - NORD
This graph depicts monthly trends in cover height mean across years at WAKANAMA_NORD Station.
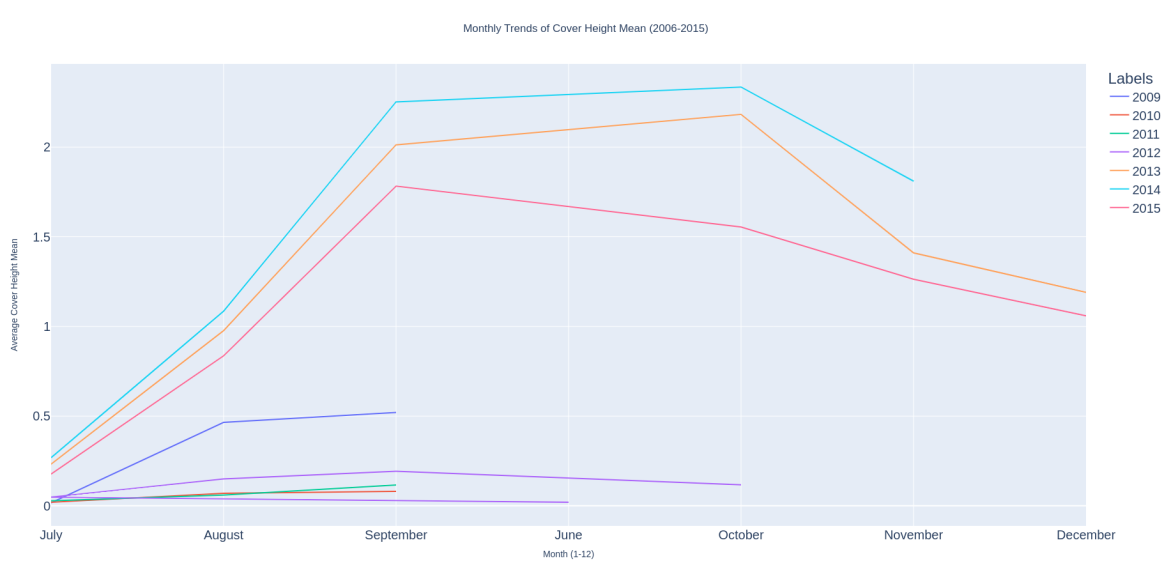
Cover Height Mean across Years - SUD
This graph depicts monthly trends in cover height mean across years at WAKANAMA_SUD Station.