Graphs
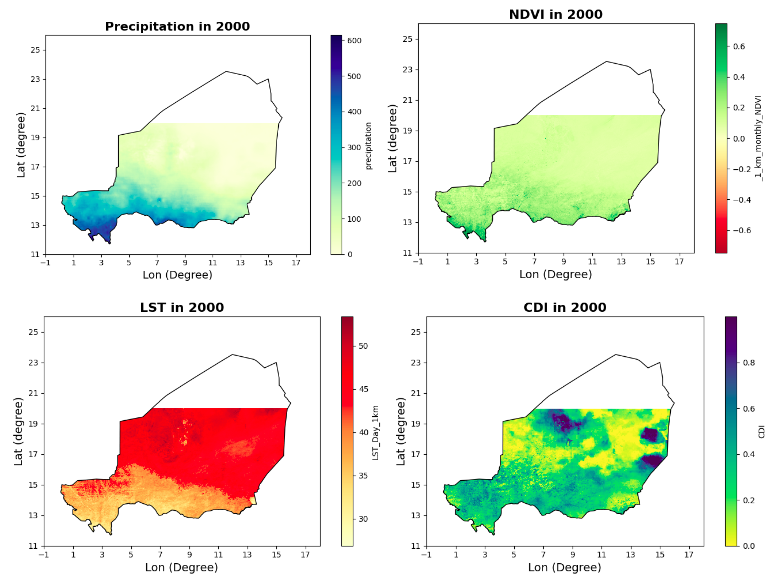
CDI Analysis - 2000
This graph depicts Precipitation , NDVI , LST and CDI for the year 2000.
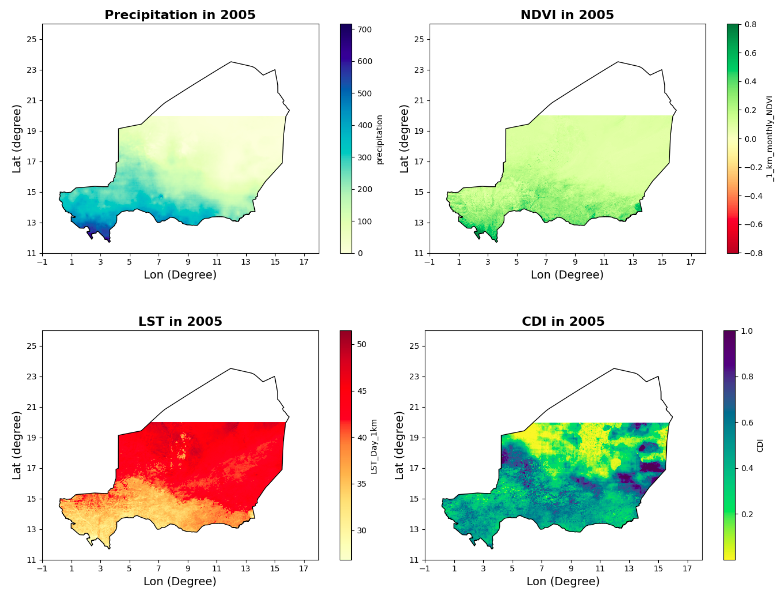
CDI Analysis - 2005
This graph depicts Precipitation , NDVI , LST and CDI for the year 2005.
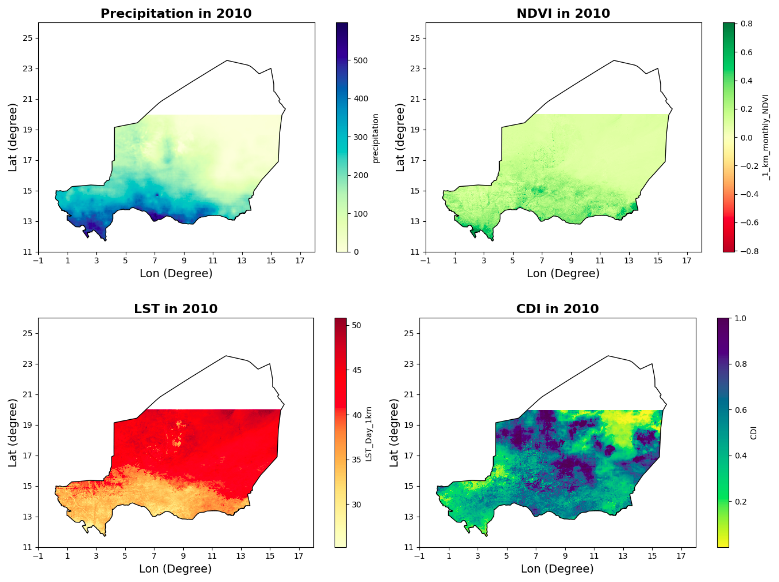
CDI Analysis - 2010
This graph depicts Precipitation , NDVI , LST and CDI for the year 2010.
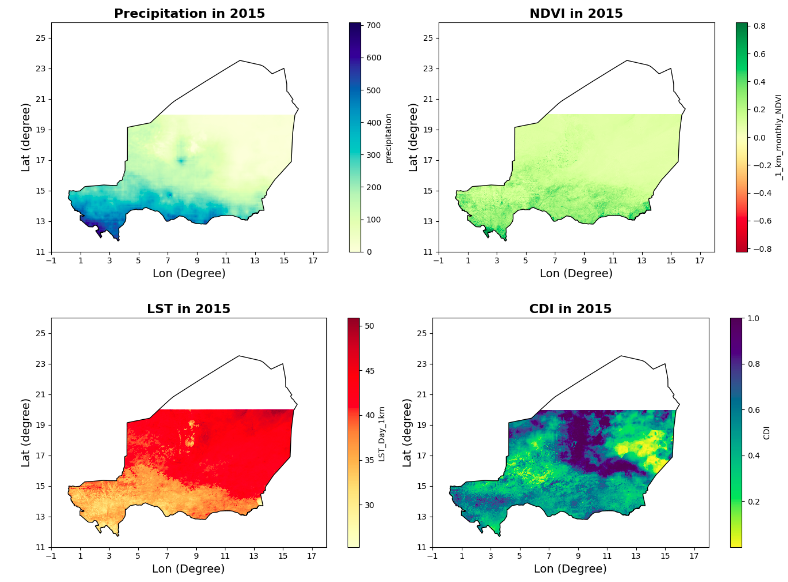
CDI Analysis - 2015
This graph depicts Precipitation , NDVI , LST and CDI for the year 2015.
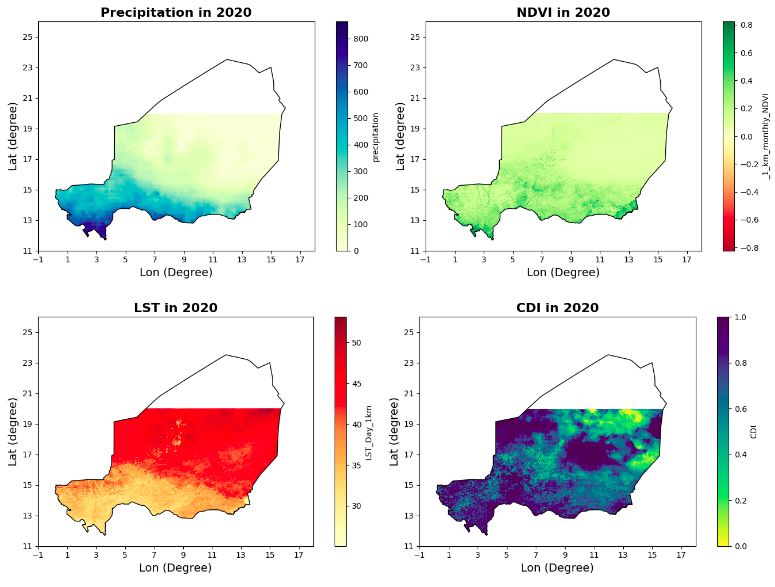
CDI Analysis - 2020
This graph depicts Precipitation , NDVI , LST and CDI for the year 2020.