Graphs
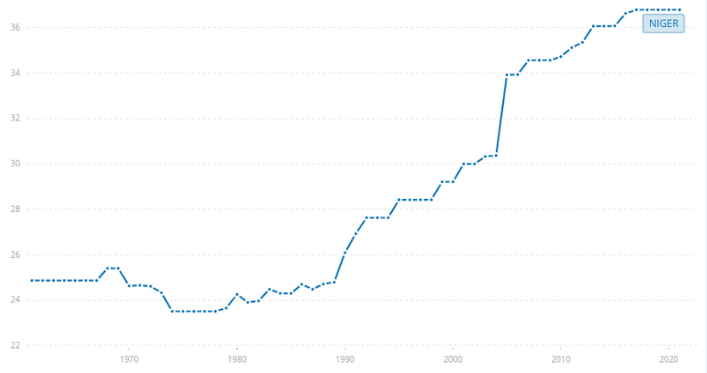
Year vs Loss in Billion Dollars in USA
This contains the loss in billion dollars in USA during the time period 1980-2022.
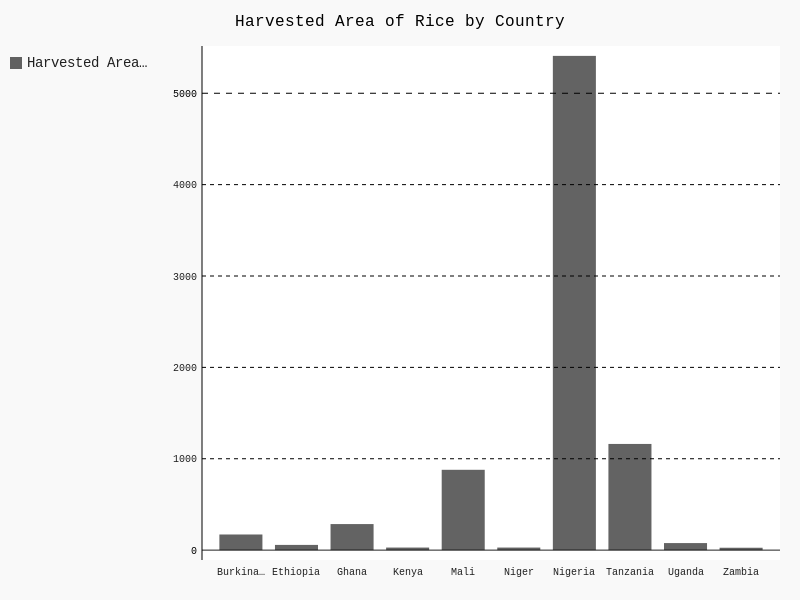
Harvested Area of Rice across Countries
This Graph depicts the harvested area of rice across countries in Sahel region.
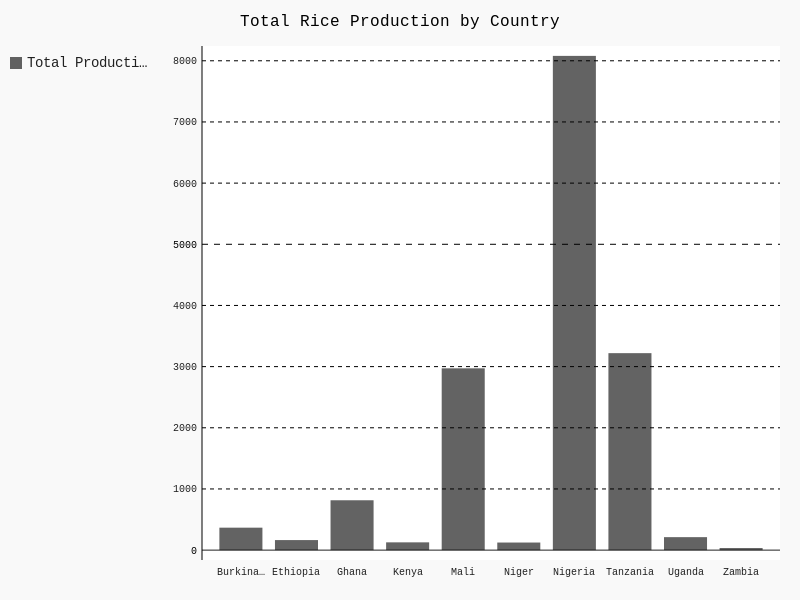
Total Rice Production by Country
The Graph depicts the total rice production by country in Sahel region.
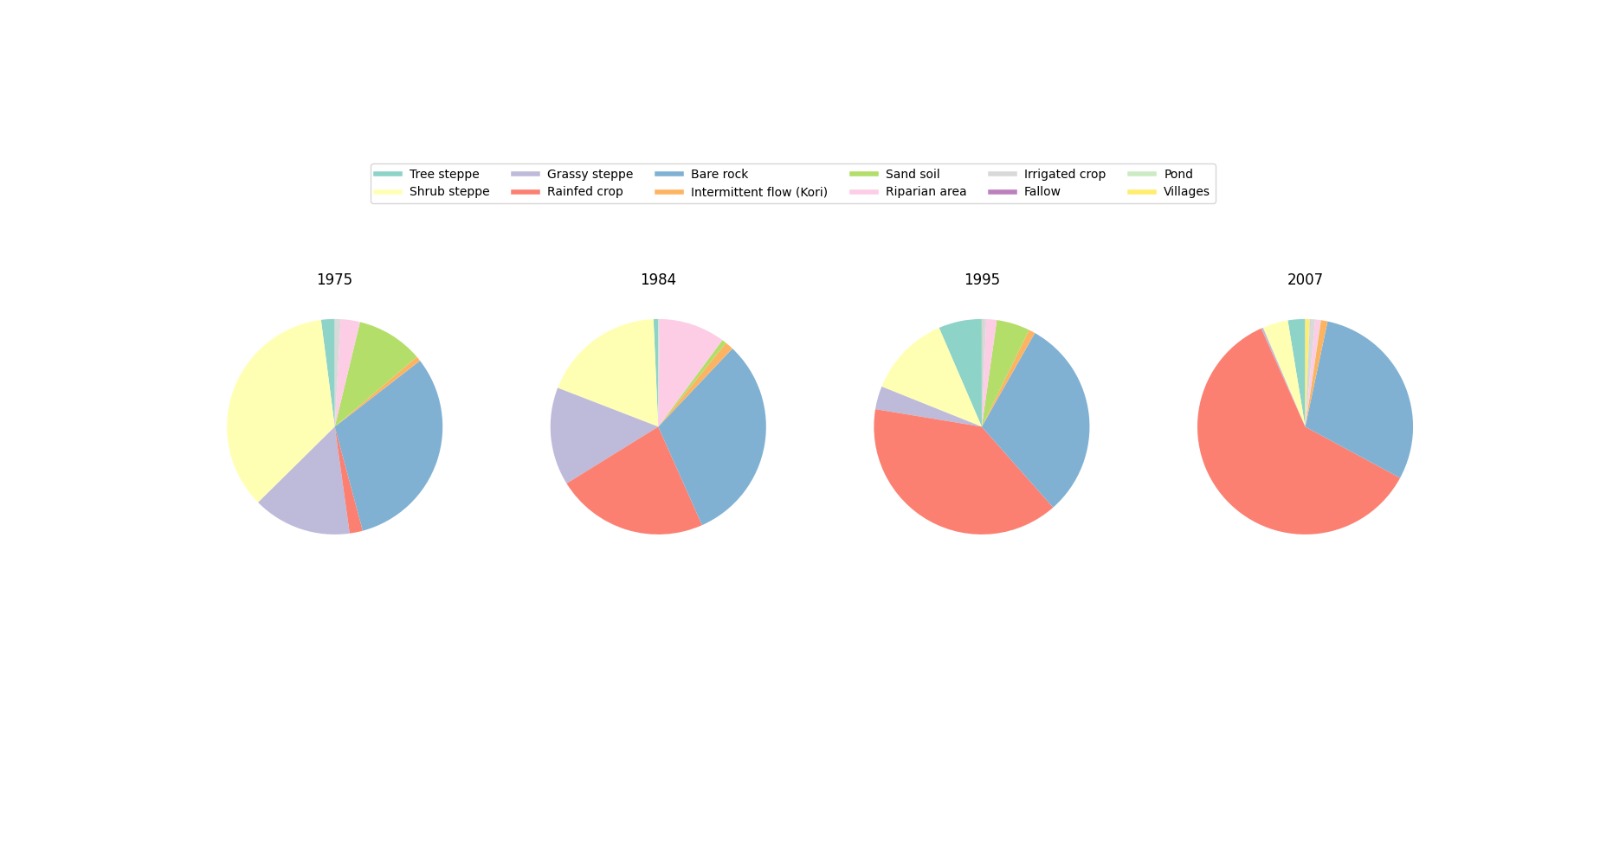
Distribution of Land Usage in Keita Valley
The Graph depicts the distribution of land usage in Keita Valley in Niger.
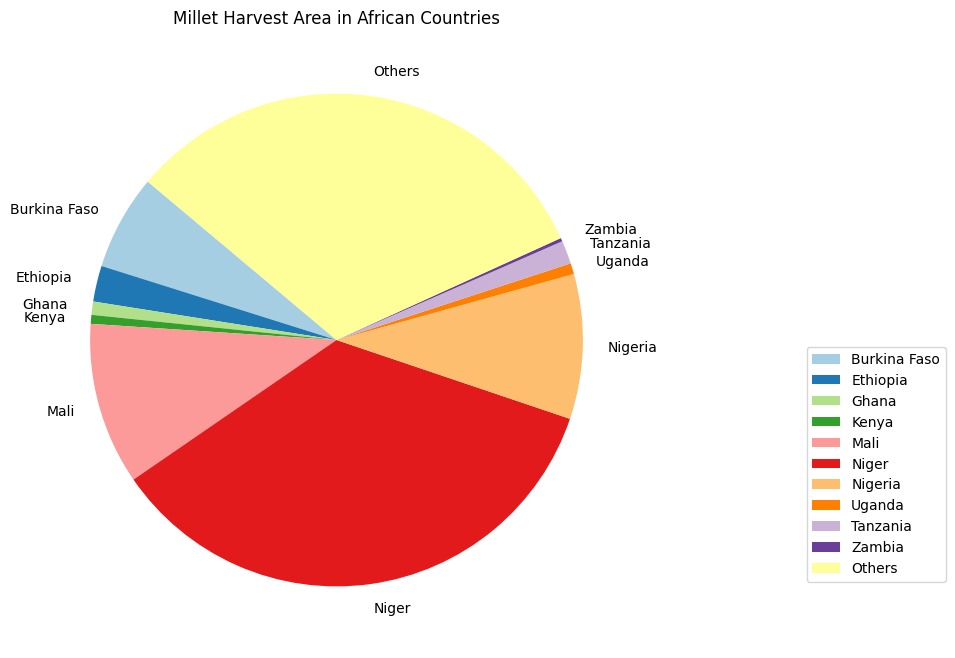
Harvested Area of Millet Crops by Country
The Graph depicts the harvested area of millet crops by country in Sahel region.
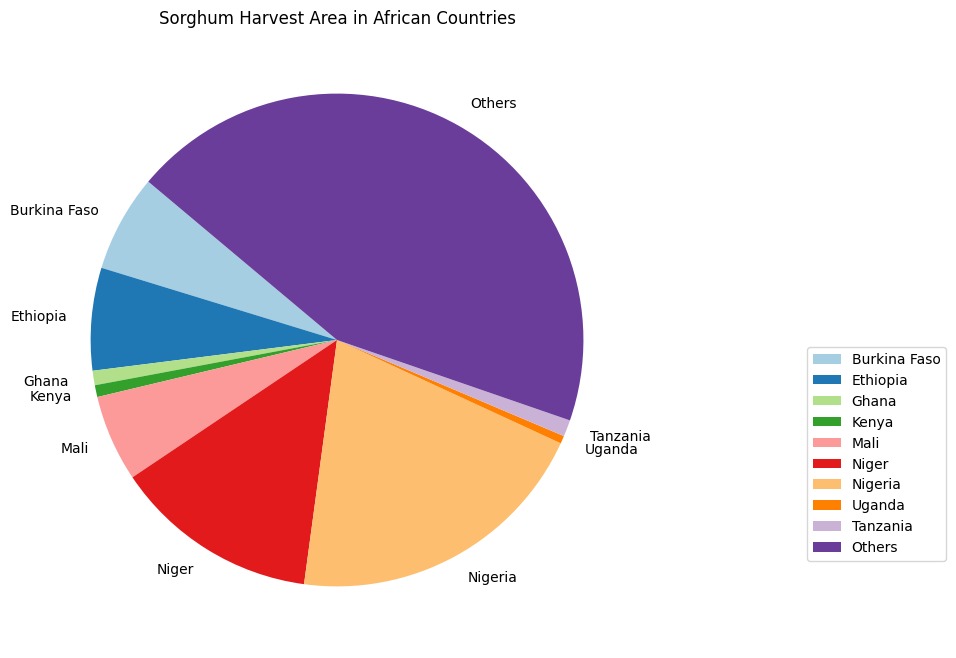
Harvested Area of Sorghum Crops by Country
The Graph depicts the harvested area of sorghum crops by country in Sahel region.
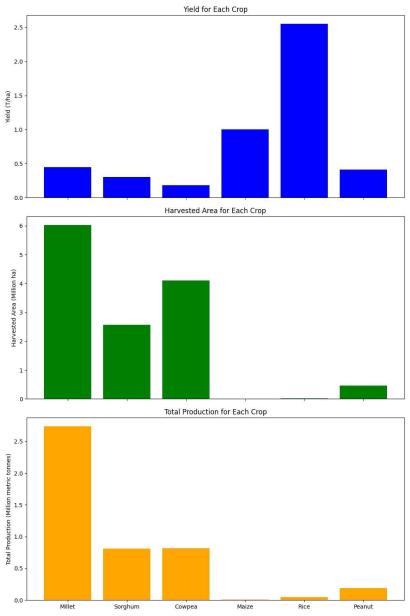
Yield and Production across Crops
The Graph depicts the yield and production across crops like Millet , Sorghum , Cowpea , Rice and Maize in Sahel region.